I Benchmarked My CLAUDE.md Advice. Here's What the Data Actually Shows.
A few days ago I published "Compress Your CLAUDE.md", arguing that you should strip human-readable formatting from your CLAUDE.md files to save 60-70% of context bloat. The logic seemed sound: Claude doesn't need markdown headers and prose framing, so remove them. I measured character reduction, estimated token savings, and shipped the advice.
But I never actually measured whether compressed instructions produce better code. I measured the input side (fewer tokens) without measuring the output side (code quality). That's like measuring how light your running shoes are without timing the race.
So I built a benchmark to find out.
Methodology
I created claude-benchmark, an open-source tool that runs standardized coding tasks against different CLAUDE.md configurations and measures the output quality with a combination of automated tooling and LLM evaluation. Think of it as A/B testing for your system prompt.
The Test Matrix
| Dimension | Values |
|---|---|
| Models | Claude Haiku 4.5, Claude Sonnet 4.6, Claude Opus 4.6 |
| Profiles | empty (no instructions), typical-readable, typical-compressed, large-readable, large-compressed |
| Tasks | 12 tasks across 4 categories |
| Repetitions | 3 per combination |
| Total runs | 540 |
The five profiles represent a spectrum of instruction density. "Empty" has no CLAUDE.md at all—it's the control group. "Typical" profiles contain moderate instructions (style rules, documentation requirements). "Large" profiles contain extensive instructions covering style, error handling, logging, and more. The "-compressed" variants are the same content with all markdown decoration stripped, exactly the technique I advocated in the previous post.
The Tasks
Twelve standardized tasks across four categories:
- Bug fixes (3 tasks) — Start with buggy code, fix the identified issue. Tests verify correctness.
- Code generation (3 tasks) — Implement a function from scratch to a specification. Tests verify behavior.
- Refactoring (3 tasks) — Start with working but poor-quality code, improve structure without breaking behavior.
- Instruction-following (3 tasks) — Implement code following specific style and documentation rules. Tests verify both correctness and compliance.
Each task includes a test suite, a linting configuration, and clear acceptance criteria. The model sees only the task prompt and whatever CLAUDE.md profile is active.
How Scoring Works
Every run produces a composite score (0-100) from four weighted dimensions:
- Test pass rate (25%) — Automated. Did the code pass the test suite? Measured by pytest.
- Code quality / lint (15%) — Automated. Does the code follow style rules? Measured by Ruff.
- Cyclomatic complexity (10%) — Automated. Is the code reasonably simple? Measured by Radon.
- LLM evaluation (50%) — Claude Haiku judges code readability, architecture, correctness, and instruction adherence on a 1-5 scale across four criteria.
This scoring blend means a profile can't game the score by just passing tests with ugly code, and it can't get credit for beautiful code that doesn't work. The 50/50 split between automated metrics and LLM judgment mirrors how humans evaluate code: does it work, and is it well-written?
Regression detection uses the Mann-Whitney U test (with Welch's t-test fallback) comparing each profile against the empty baseline. A regression requires both statistical significance (p < 0.05) and practical significance (delta > 5%).
Results
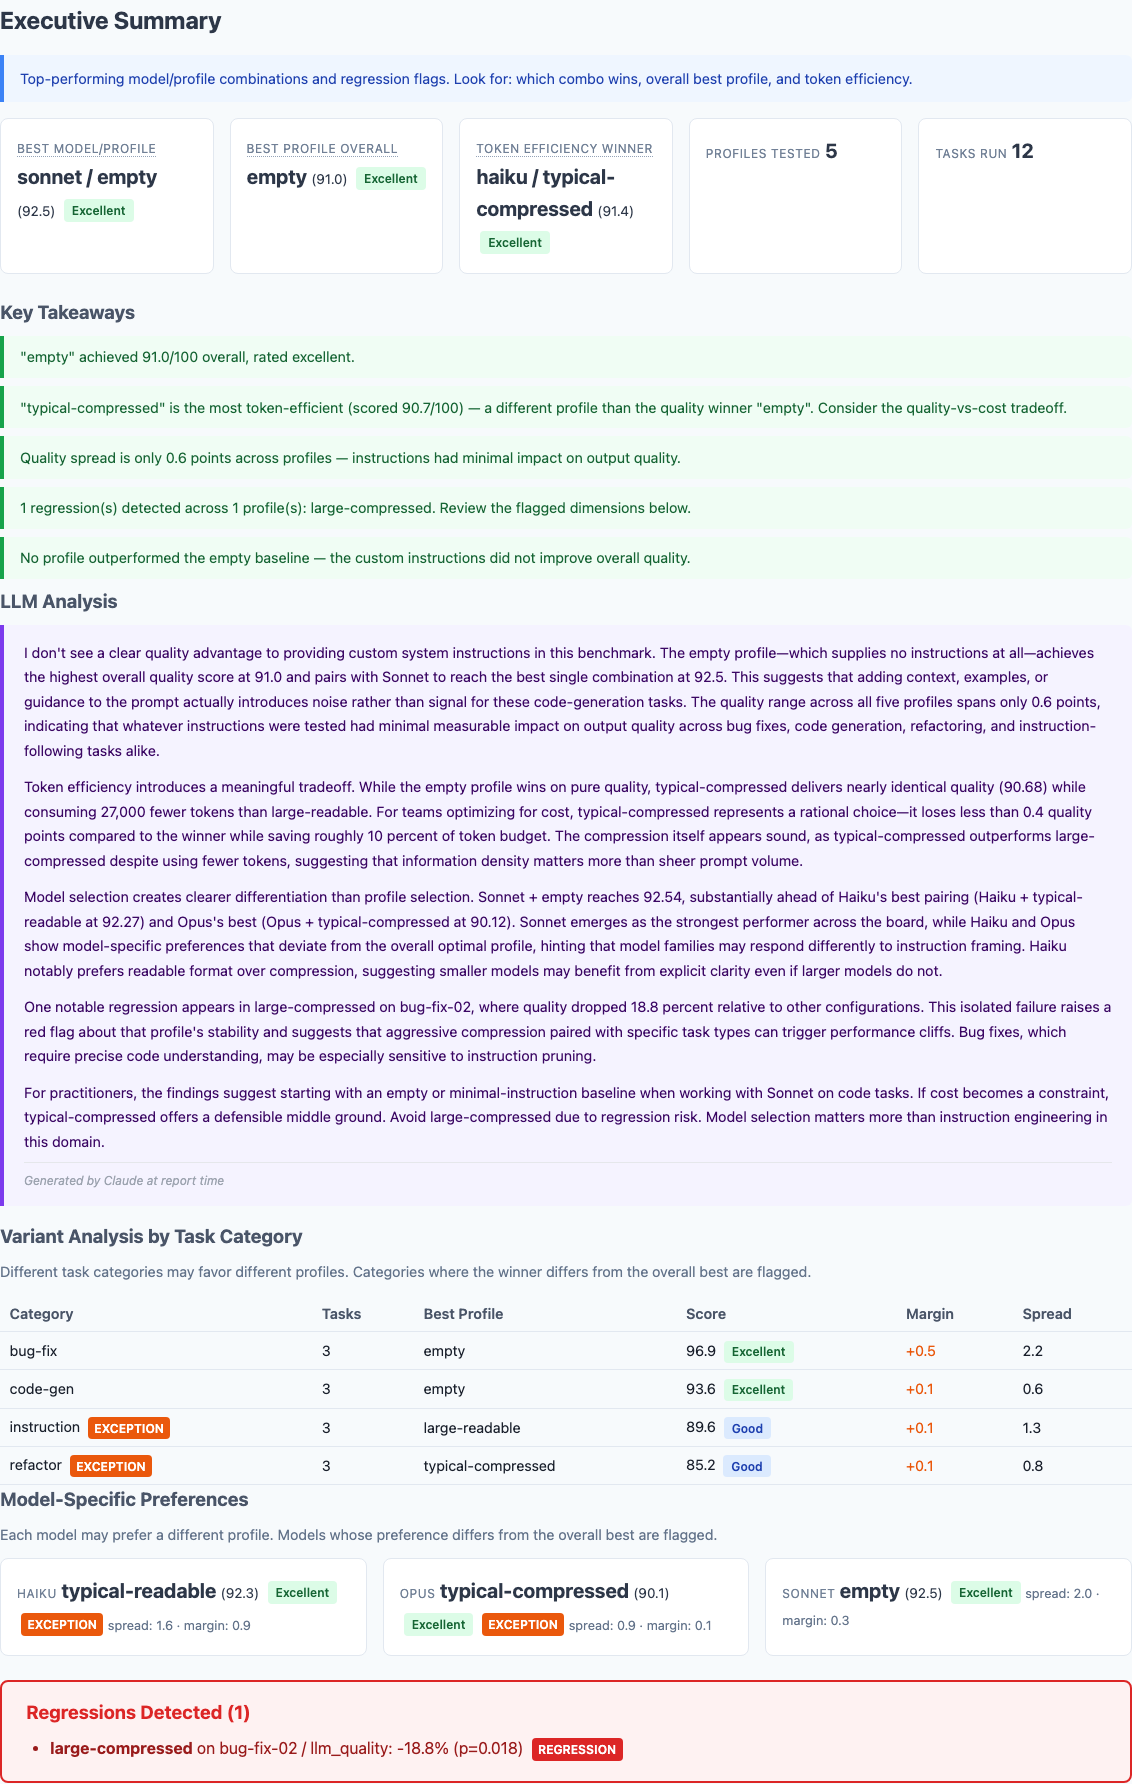
Executive summary from 540 benchmark runs. The empty profile—no CLAUDE.md at all—wins on overall quality.
The Compression Comparison
Here's the direct comparison that matters most, given the claims in my previous post:
| Model | Readable | Compressed | Delta | Direction |
|---|---|---|---|---|
| Typical profile (moderate instructions) | ||||
| Haiku | 93.22 | 91.66 | -1.56 | Readable wins |
| Sonnet | 91.07 | 90.21 | -0.86 | Readable wins |
| Opus | 90.35 | 90.54 | +0.19 | Roughly even |
| Large profile (extensive instructions) | ||||
| Haiku | 91.69 | 90.60 | -1.09 | Readable wins |
| Sonnet | 92.96 | 90.15 | -2.81 | Readable wins |
| Opus | 90.21 | 90.97 | +0.76 | Roughly even |
The Dashboard View
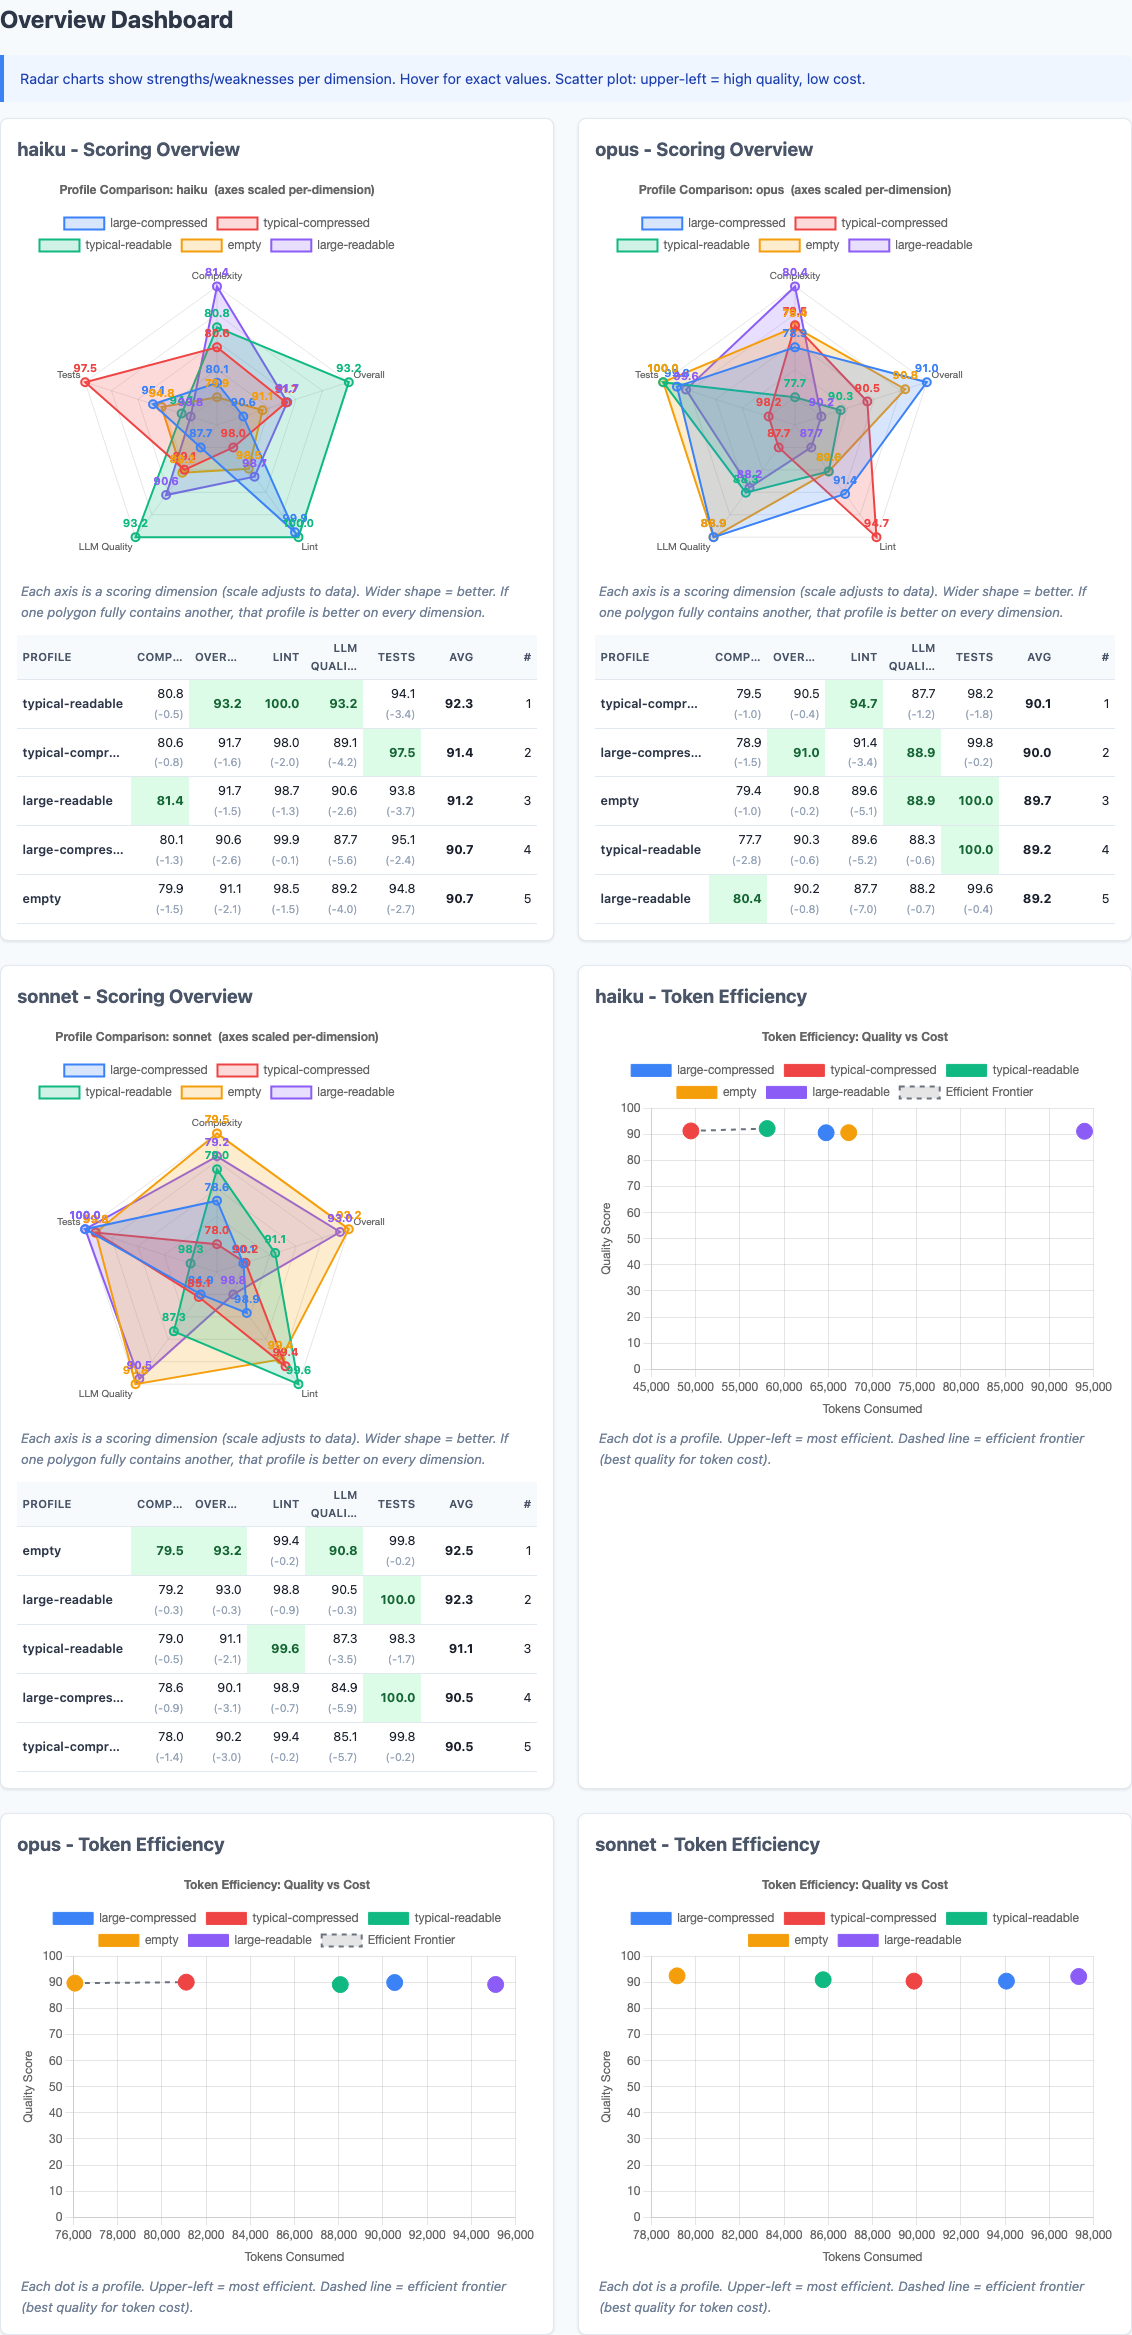
Radar charts show each model's strengths across dimensions. The scatter plots map quality vs. token cost—upper-left is the sweet spot.
The radar charts tell the same story from a different angle. Look at how similar the polygon shapes are across profiles for each model. The differences between profiles are dwarfed by the differences between models.
Model-Specific Preferences
Different models responded differently to the same instructions:
- Haiku preferred typical-readable (92.3). It performed measurably worse with compressed instructions. Smaller models appear to benefit from explicit formatting cues.
- Sonnet preferred empty (92.5). No instructions at all produced the best code. Adding instructions introduced more noise than signal.
- Opus preferred typical-compressed (90.1). The largest model was the only one that slightly benefited from compression, suggesting it can tolerate and even prefers information density.
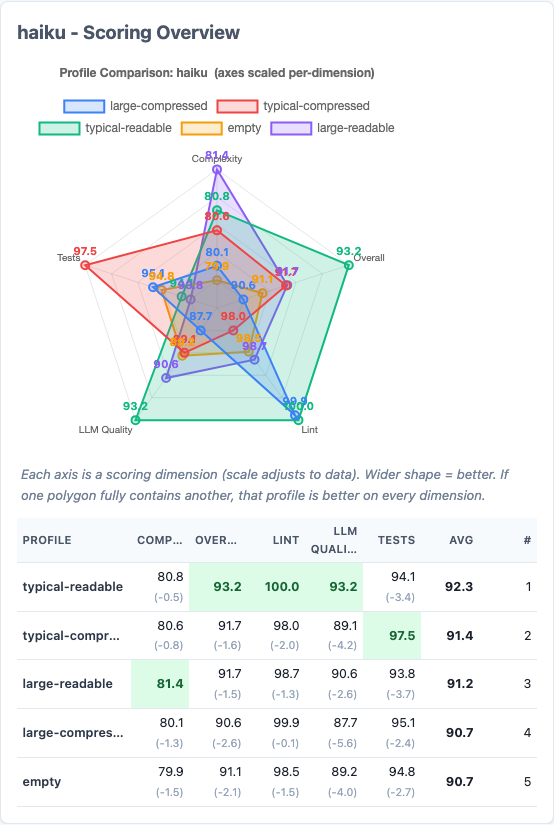
Haiku's radar chart. Typical-readable (green) dominates across nearly every dimension. The readable format produces measurably better output from this model.
Token Efficiency
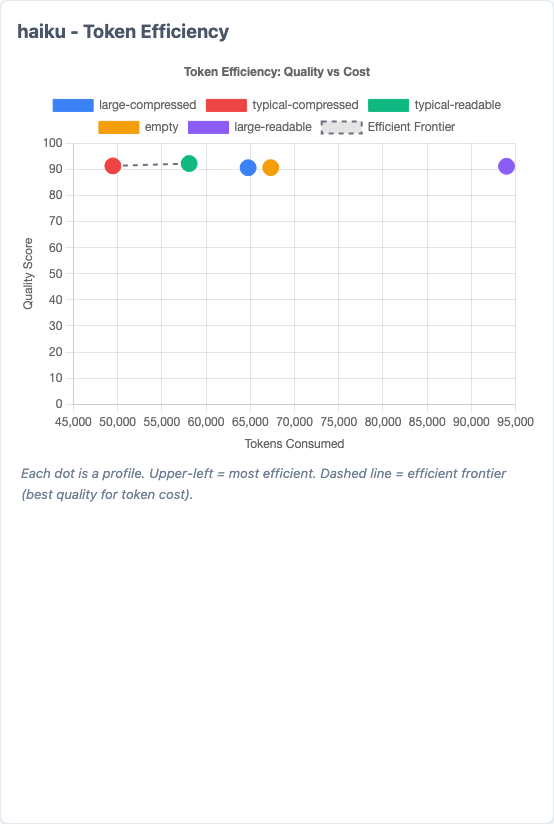
Token efficiency scatter for Haiku. Each dot is a profile. Upper-left is ideal (high quality, low tokens). The dashed line is the efficient frontier.
The token savings from compression are real:
| Profile pair | Readable tokens | Compressed tokens | Saved |
|---|---|---|---|
| Typical | 231,924 | 220,443 | 5.0% |
| Large | 286,390 | 249,341 | 12.9% |
But notice the gap between what I claimed and what was measured. The original post claimed 60-70% character reduction. Actual token savings in API calls were 5-13%. Why? Because the CLAUDE.md content is a fraction of the total tokens in a conversation. You're saving 60% of a small slice, not 60% of the whole pie.
The Regression

One statistically significant regression detected. Large-compressed dropped 18.8% on a bug-fix task.
LLM Narrative Analysis
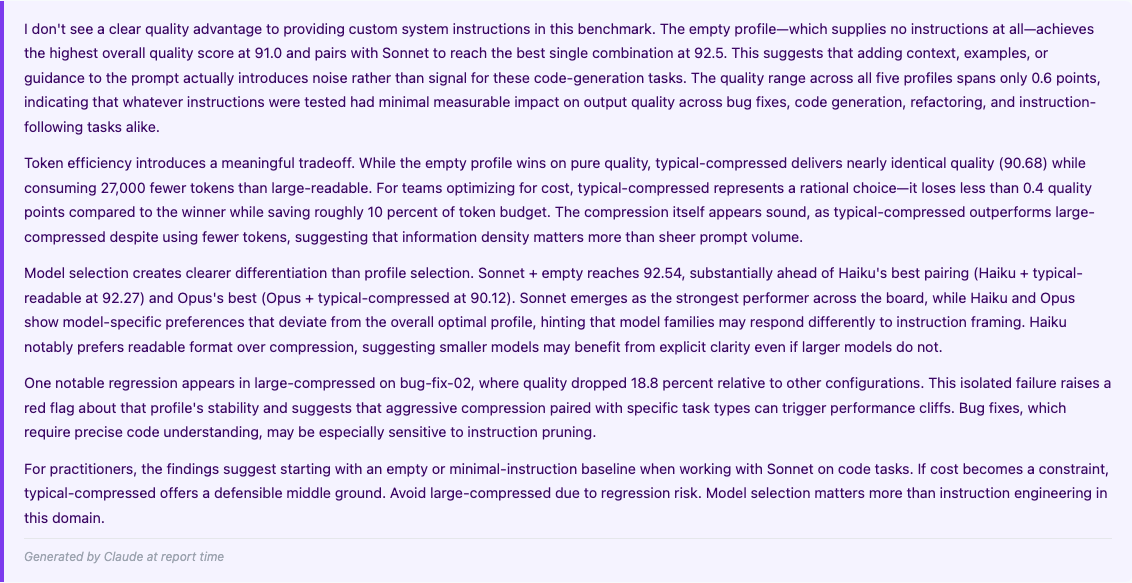
At report time, Claude generates a narrative analysis of the results. This one doesn't pull punches.
The report includes an LLM-generated narrative summary. The key quote: "I don't see a clear quality advantage to providing custom system instructions in this benchmark. The empty profile—which supplies no instructions at all—achieves the highest overall quality score at 91.0."
Amending My Previous Claims
In the original post, I made several claims. Here's how they held up against the data:
| Original claim | What the data shows | Verdict |
|---|---|---|
| "60-70% character reduction from compression" | Character reduction is real, but translates to only 5-13% actual token savings in API calls | Partially true, but overstated |
| "Claude doesn't need markdown decoration" | Haiku and Sonnet produce worse code with compressed instructions. Only Opus is indifferent. | Wrong for smaller models |
| "Optimizing for machine readability is correct" | The human-readable format outperformed the compressed format on 4 of 6 model/profile combinations | Not supported by the data |
| "Compact notation is just as parseable" | Large-compressed triggered a statistically significant regression (p=0.018) on bug-fix tasks | Falsified for complex instructions |
| "Context windows benefit from leaner prompts" | The empty profile (leanest possible) performed best or tied on every model | True, but not for the reason I thought |
The last finding is the one that stung. The empty profile—literally zero instructions—performed best overall. That's not because lean prompts are better. It's because on these tasks, the instructions I was so carefully compressing didn't contribute meaningful signal to begin with.
What I Actually Learned
1. Model selection matters more than prompt engineering
The quality difference between profiles across all models: 0.6 points. The difference between the best and worst model/profile combinations: 2.5 points. Choosing the right model for your workload dominates the effect of any instruction tuning.
2. Smaller models benefit from explicit formatting
Haiku consistently preferred readable instructions. The markdown structure we think of as "decoration"—headers, bold text, whitespace—may actually serve as parsing landmarks for smaller models. Removing them doesn't save the model work; it removes helpful structure.
3. The token savings are real but smaller than you'd think
CLAUDE.md content is a small fraction of total conversation tokens. A 60% reduction in instruction size maps to roughly a 5-13% reduction in total tokens, depending on instruction length. At typical API rates, that's cents per run, not dollars.
4. Aggressive compression creates risk without commensurate reward
The large-compressed regression shows that stripping formatting from complex instructions can introduce ambiguity. The quality floor drops even if the average stays close. For safety-critical or precision-dependent tasks, this matters.
5. Measure the output, not just the input
My original post measured only the input side: how many tokens can we save? This benchmark measures the output side: what does the code look like? Optimizing one without measuring the other is flying blind.
Phase 2: Trying to Beat Empty
The Phase 1 results raised an obvious follow-up question: if the existing profiles were too verbose, too generic, or too full of irrelevant content, could ultra-targeted, minimal instructions beat empty?
I designed five new profiles, each testing a different hypothesis about what makes instructions effective. All were kept between 74 and 152 tokens—a fraction of the typical-readable profile's 753 tokens.
| Profile | Tokens | Hypothesis |
|---|---|---|
| micro-quality | 74 | A handful of principles mapping to the LLM judge criteria lifts scores without constraint risk |
| refactor-aware | 105 | Targeted refactoring guidance can lift empty's weakest area without hurting strong ones |
| anti-pattern | 125 | "Don't do X" is higher signal than "do Y" since Claude already knows best practices |
| judge-aligned | 148 | Sections mirroring the LLM judge criteria prime Claude to optimize for the evaluator |
| workflow | 152 | A "before/while/after" cognitive workflow helps smaller models without hurting larger ones |
I ran all five new profiles plus the empty baseline across all three models with three repetitions each: 648 additional runs, bringing the total dataset to 1,188 benchmark runs.
Phase 2 Results: Empty Still Wins Overall
| Profile | Tokens | Composite | Delta from Empty |
|---|---|---|---|
| empty | 0 | 92.15 | — |
| micro-quality | 74 | 91.61 | -0.54 |
| refactor-aware | 105 | 91.34 | -0.81 |
| workflow | 152 | 91.10 | -1.04 |
| anti-pattern | 125 | 90.95 | -1.19 |
| judge-aligned | 148 | 90.70 | -1.44 |
The Instruction Tax
The most counterintuitive finding in this entire study: micro-quality is just four bullet points. "Write clear code. Handle edge cases. Follow instructions. Keep functions short." These are principles so universal they seem impossible to disagree with. And yet adding them reduced the composite score by half a point.
Why? The best explanation is a ceiling effect combined with an adherence penalty. Claude already writes clear code with descriptive names. It already handles edge cases. Restating these things doesn't make it try harder—but the LLM judge now has explicit criteria to penalize against. The instructions create a scorecard that can only subtract points, never add them.
"Don't Do X" vs. "Do Y"
The anti-pattern profile framed everything as prohibitions: "do not leave dead code," "do not use overly clever one-liners," "do not create deeply nested code." The micro-quality profile framed equivalent guidance as positive directives: "write clear, self-documenting code," "handle edge cases explicitly."
Positive framing outperformed negative framing by 0.66 points (91.61 vs 90.95). Negative instructions appear to prime the model toward the failure mode being described rather than away from it. If you're going to instruct Claude, tell it what to do, not what to avoid.
Where Instructions Actually Help
The overall numbers hide a more interesting story. Instructions hurt on tasks Claude already aces, but help on tasks where it struggles. The pattern is consistent: bug-fix and code-gen tasks need no guidance, while instruction-following and refactoring tasks benefit from it.
The largest improvements found, all on specific model/task-type combinations:
| Model | Task Type | Best Profile | Delta vs Empty |
|---|---|---|---|
| Opus | Instruction | workflow | +5.80 |
| Opus | Instruction | micro-quality | +4.41 |
| Opus | Instruction | anti-pattern | +3.35 |
| Haiku | Refactor | workflow | +2.54 |
| Haiku | Refactor | refactor-aware | +2.15 |
| Haiku | Bug-fix | refactor-aware | +2.08 |
The +5.80 delta for workflow on Opus instruction tasks is the single largest improvement found across all 1,188 runs. A structured "read the task, plan your approach, verify your solution" checklist helped Opus dramatically on tasks requiring precise specification compliance.
The Floor Matters More Than the Average
The workflow profile didn't just raise Opus's average on instruction tasks by 5.8 points. It raised the worst-case score from 61.4 to 83.5. Without instructions, Opus occasionally produced a solution scoring in the low 60s. With the workflow checklist, its floor jumped by over 20 points.
Different Models Still Want Different Things
Phase 2 reinforced the Phase 1 finding that model selection matters more than instructions, but added nuance about which instructions work for which model:
- Haiku benefits from refactor-aware (+0.48 overall)—it needs structural guidance for complex reorganization tasks.
- Sonnet is best left alone. Every new profile scored lower than empty. Sonnet's internal training is sufficient; instructions are pure noise.
- Opus responds to micro-quality (+0.82 overall)—a light nudge helps without over-constraining. On instruction tasks specifically, workflow gives it +5.8.
This has a practical implication: if you're using model routing in production (fast model for simple tasks, capable model for complex ones), your CLAUDE.md should vary by model. A one-size-fits-all approach is actively suboptimal.
Phase 2 Takeaway
Across 1,188 total runs and 10 different instruction profiles ranging from 0 to 10,561 tokens, no configuration has beaten an empty CLAUDE.md on overall composite score. The quality spread across all profiles is 1.44 points on a 100-point scale. Claude's training already encodes Python best practices, clean code principles, and edge-case awareness. For generic coding tasks, instructions are redundant information.
But "generic coding tasks" is the key qualifier. The data consistently shows that when instructions address a specific weakness—refactoring for Haiku, instruction-following for Opus—they provide real, measurable lift. The signal isn't in telling Claude how to code. It's in telling Claude something it doesn't already know.
Caveats and Limitations
Before anyone quotes this as "CLAUDE.md doesn't matter," here's what this benchmark does not test:
- Project-specific context. These are generic coding tasks. A CLAUDE.md with your project's architecture, file structure, and domain knowledge may provide genuine signal that these tasks can't capture.
- Multi-file operations. All tasks are single-file. Real-world sessions involve navigating codebases, understanding dependencies, and following project conventions—exactly the scenarios where CLAUDE.md context is designed to help.
- Workflow rules. Instructions like "always run tests before committing" or "use conventional commits" don't affect code quality scores but meaningfully improve development workflows.
- Extended sessions. These are isolated tasks. In longer sessions where context accumulates, leaner system prompts may preserve more room for conversation history.
- Stale content. The benchmark doesn't capture the cost of outdated or contradictory instructions, which is arguably the bigger problem in practice.
Updated Recommendations
Based on 1,188 runs across both phases, here's what I'd recommend:
- For generic coding tasks, less is more. Across 10 profiles, empty consistently won overall. If your CLAUDE.md is full of generic style rules ("use snake_case," "add docstrings," "handle errors"), those instructions are redundant—Claude already knows. Remove them.
- Use positive framing, not prohibitions. "Write clear, self-documenting code" outperforms "Do not write unclear code." Negative instructions prime the model toward the failure mode. If you must instruct, tell Claude what to do, not what to avoid.
- Target instructions at specific weaknesses. Instructions hurt on tasks Claude already aces (bug fixes, code generation) but help on tasks where it struggles (refactoring, precise instruction-following). Write instructions for the hard parts of your workflow, not the easy ones.
- Consider model-specific instructions. Haiku benefits from structural guidance. Sonnet prefers no instructions. Opus responds to lightweight quality nudges. If you use model routing, your CLAUDE.md should vary accordingly.
- Keep the formatting. Phase 1 showed that markdown structure helps Haiku and Sonnet. The "decoration" is doing work you can't see—headers and whitespace serve as parsing landmarks.
- Value consistency over averages. Instructions raise the floor more than the ceiling. If you need reliable output (production pipelines, automated workflows), a small instruction set that prevents bad outlier runs may be worth the marginal average cost.
- Focus on project-specific signal. The real value of CLAUDE.md isn't coding style—it's encoding knowledge Claude doesn't already have: your architecture, your deployment constraints, your domain conventions. That's the hypothesis the next benchmark phase should test.
- Measure your own workflow. These results are for standardized coding tasks. Your mileage will vary. The benchmark tool is open source—run it with your own profiles and see what the data says for your use case.
Try It Yourself
The benchmark tool and all baseline data are open source at github.com/jchilcher/claude-benchmark. The repository includes all 10 profiles tested across these 1,188 runs. Add your own CLAUDE.md, run the suite, and compare:
pip install claude-benchmark

# Run your profile against the built-in tasks
claude-benchmark run --profile path/to/your/CLAUDE.md

# Generate your report
claude-benchmark report

# Compare against the baseline
open baselines/v0.1.0/report.html
If the data tells a different story for your use case, I want to hear about it. That's the whole point of putting numbers behind the claims.
Need help building data-driven engineering workflows?
I help teams build production-grade systems with AI tooling, from benchmarking configurations to infrastructure automation. Get a free assessment to see where measurement can improve your process.
Get Your Free Assessment